Sunday, 20 October 2013

When is a Transaction not a Transaction

Question: When is a transaction not a transaction?

Answer: When is not durable
Databases transactions are designed to ensure that selects, inserts, updates and deletes are processed reliably in the context of a single operation. To be more exact transactions implement the so called ACID properties which are:
·         Atomicity: The changes to the database all happen or none of them do
·         Consistency: The changes ensure that all validation rules apply and the database is left in a consistent state
·         Isolation: Changes made by one user are isolated from others until the transaction is complete
·         Durability: Once a transaction is complete it will remain so, regardless of power loss or other failures
A SQL Server transaction starts with BEGIN TRAN and ends with COMMIT or ROLLBACK and looks something like this:

BEGIN TRAN
                UPDATE …
                INSERT …
                DELETE …
COMMIT TRAN
Transactions in SQL Server are managed through the use of locks which protect one transaction from others and the transaction log which is separate storage that records all the changes to the database in addition to them being recorded in the database itself. In particular for a commit the data is guaranteed to be written to the transaction log:

The above model has served us well since SQL Server was invented (i.e. version 1.0). But SQL Server 2014 is adding a feature called DELAYED_DURABILITY. This is used as follows:

1.       ALTER DATABASE … SET DELAYED_DURABILITY = ALLOWED
·         Other options are DISABLED and FORCED
·         The database has to allow delayed durability before it can be used in a transaction

2.       BEGIN TRAN …  COMMIT TRAN WITH DELAYED_DURABILITY = ON (or OFF)
·         Makes a particular transaction non-durable 

3.       CREATE PROC … AS BEGIN ATOMIC WITH (DELAYED_DURABILITY = ON …
·         Makes a the transaction associated with the procedure non-durable
·         Only applies to native in memory procedures (another new feature in SQL Server 2014)  

In short the DELAYED_DURABILITY clause in the above allows the transaction to be non-durable breaking the ACID properties. To be exact it allows a transaction COMMIT to complete before all the data is written to the transaction log. 

So why does SQL Server 2014 need a special command that breaks durability? One answer is speed!

The fact is that on very high performance transactional systems the writes to the transaction log are the biggest I/O bottleneck simply because all data has to be written there before the COMMIT can complete.  One technique I have often used is to place the transaction log on a dedicated high speed disk drive to minimise the overhead of this. However in some systems the transaction log is still the limiting factor of overall performance.

I was monitoring a database recently that did high volume inserts of large records and I could see that the Wait State was often WRITE_LOG for the INSERT statements, thereby indicating that the transaction log was the limiting factor for performance.

Allowing a transaction to have DELAYED_DURABILITY means that SQL Server does not have to write the log immediately on COMMIT. Instead it can wait, holding data in cache, and then combine it with data from other transactions before writing it. This means fewer larger writes to the log increasing overall speed. Note the data is always written, just later than usual.

The danger of DELAYED_DURABILITY is that should the system fail then it could happen that a particular committed transaction may not be in the log and so on restart that transaction will be lost. This will only occur for the very latest transactions and will be similar to the way the updates for a transaction that has not yet been committed are lost on system failure.

It is a business decision as to whether this additional small loss of data is acceptable and I expect in many cases it will be given the low probability it will happen and the extra system performance it will provide.

In summary with SQL Server 2014 we will be able to choose to have DELAYED_DURABILITY for some or all of our transactions allowing us to squeeze even more performance out of the high volume transactional systems that require it.

Monday, 17 June 2013

SQL Server 2014 Takes Advantage of Low Price Memory

It may seem like only yesterday that SQL Server 2012 was launched, but SQL Server 2014 is already on its way. A preview copy is to be soon made available and the production release is due before the end of 2013. This was all announced at TechEd 2013 conference.

Whilst there are a number of new features being announced for SQL Server 2014 it has certain features that take advantage of lower memory prices and these are of particular interest.
One option for storing databases in memory is to just use Solid State Disks (SSDs) and you don’t need SQL Server 2014 to do this. Just add SSD disk drives to the server and create databases on them. It is that simple.

SSDs are faster because they are based on Flash memory and have no moving parts. Reads in particular are very fast when compared to a normal disk with sub-millisecond reads compared to many milliseconds. The cost of SSD storage is about three or four times that of a traditional hard drive at present and it is probably not viable to replace all the disks in your SQL Server with SSDs just yet, unless your databases are relatively small (i.e. about 500GB or less).
Also note that SQL Server treats an SSD drive just like any other disk drive, and not like memory, and so caches the data in normal RAM anyway and applies database locks for managing multi user access as per usual. As a result although replacing physical disks with SSDs will increase speed, it will not be as much as you may expect.

The additional features in SQL Server 2014 that are specifically designed to take advantage of lower memory costs are: caching frequently used data on SSDs and memory-optimized tables.
Caching frequently used data on SSDs: This feature allows you to specify an SSD device or a set of SSD devices to be used to cache data in addition to that cached in the buffer cache in server RAM. Data that is read (i.e. not data that is updated) is cached on the SSDs and so this form of caching works best for data retrieval queries.

If you have used all your normal server RAM for your buffer cache, you can add SSDs to your server and use them for additional read caching. This will vastly improve the speed of large retrieval queries. Great for reporting / data warehouse systems.


Memory-optimized tables: These allow tables to be stored and managed directly in memory. As well as getting the speed gains from having the table in memory SQL Server uses a light weight locking strategy for these tables and this greatly improves concurrent access avoiding the blocking problems that often occur with tables that are simultaneously accessed by many users.

Memory-optimized tables are stored in memory the whole time, and never on disk. Only data changes are written sequentially to disk for recovery purposes, and even this is optional because tables can be designated as being non-durable and non-logged. After a server restart non-durable tables will be empty.  The on disk transaction log is still used for memory-optimized and normal tables. Indexes are never stored on disk.

Memory-optimized tables are designed to offer vastly superior performance for online transaction processing (OLTP) systems with high numbers of reads and updates and a high degree of concurrency.

To create a memory-optimized table first the database has to have a file group for MEMORY_OPTIMIZED_DATA. This is done with the following commands:

ALTER DATABASE databasename
ADD FILEGROUP filegroupname
CONTAINS MEMORY_OPTIMIZED_DATA;

ALTER DATABASE databasename

ADD FILE (NAME='logicalname', FILENAME='foldername')
TO FILEGROUP filegroupname;

The next step is to create a table using the MEMORY_OPTIMIZED option. The DURABILITY option can be SCHEMA_AND_DATA or just SCHEMA in which case the data is non-durable:

CREATE TABLE tablename (
[col1] varchar(32) NOT NULL PRIMARY KEY NONCLUSTERED
HASH WITH (BUCKET_COUNT = 1024),
[col2] datetime NOT NULL)
WITH (MEMORY_OPTIMIZED = ON, DURABILITY = SCHEMA_AND_DATA);
 
Note that the table must have at least one index, which is the PRIMARY key in this case.

As an additional performance gain SQL Server 2014 also supports native compiled stored procedures. These procedures are compiled into the native machine code for the CPU of the server and offer additional gains above normal Transact-SQL. Native compiled stored procedures only work for memory-optimized tables.
However after all the good news please note that that there are a number of restrictions for memory-optimized tables including:
·         No IDENTITY columns
·         No Triggers
·         No FOREIGN KEY or CHECK constraints
·         And quite a few others

All in all, memory is getting cheaper and SQL Server is changing to take advantage of that. SQL Server 2014 allows SSDs to be used as additional buffer cache for retrieval operations and dedicated memory-optimized tables allow very high performance OLTP applications to be developed.

Saturday, 25 May 2013

Loading Images Into SQL Server

A requirement arose recently to import a folder full of JPEG images into a SQL Server table. I ideally wanted to achieve this using pure T-SQL code; that is without using CLR code, external stored procedures or references to OLE objects.

The first challenge was to find a way to obtain a list of all the files in a particular operating system folder. To do this I decided to use xp_cmdshell to execute the DIR *.jpg command. The results returned from the EXEC statement can then be stored in a database table using the INSERT … EXEC statement. The required code is:
INSERT INTO ImportedImages(FileName)
EXEC xp_cmdshell 'dir c:\work\images\*.jpg /B'

DELETE
FROM ImportedImages

WHERE FileName IS NULL

The DELETE is used to necessary to clear out a NULL file name returned by DIR.
The next challenge is, given a file name, to import the contents of the file into a column in a record in the database. The OPENROWSET function has a BULK option that can do this and the required command is:

SELECT bulkcolumn
FROM OPENROWSET(BULK 'C:\work\Images\1001.jpg', SINGLE_BLOB) AS I

This can be combined with an update to directly update the image column in the database as follows:

UPDATE ImportedImages
SET ImageData = (SELECT bulkcolumn
FROM OPENROWSET(BULK 'C:\work\Images\1001.jpg', SINGLE_BLOB) AS I)
WHERE FileName = 'C:\work\Images\1001.jpg'

The rest of the code just requires a cursor to loop through each file name and load the images one by one using dynamic SQL.
The full code including creating the database table is:

-- Create the table to hold the images
CREATE TABLE ImportedImages(
      FileName sysname NULL, ImageData varbinary(max) NULL)
GO

-- Get images names from folder
INSERT INTO ImportedImages(FileName)
EXEC xp_cmdshell 'dir c:\work\images\*.jpg /B'

DELETE FROM ImportedImages
WHERE FileName IS NULL
GO

-- Import all impages from folder
DECLARE C CURSOR FOR
      (SELECT FileName FROM ImportedImages WHERE ImageData IS NULL)
DECLARE @FileName sysname
DECLARE @Path sysname
DECLARE @SQL varchar(max)

-- Loop through each file loading the images one by one
OPEN C
FETCH NEXT FROM C INTO @FileName
WHILE (@@FETCH_STATUS <> -1)
BEGIN
  SET @Path = 'C:\work\Images\' + @FileName
  SET @SQL =
  'UPDATE ImportedImages
      SET ImageData = (SELECT bulkcolumn FROM OPENROWSET(
      BULK '''
+ @Path + ''', SINGLE_BLOB) AS IMAGE)
      WHERE FileName = ''' + @FileName + ''''
  EXEC (@sql)
  FETCH NEXT FROM C INTO @FileName
END
CLOSE C
DEALLOCATE C

Saturday, 13 April 2013

Mapping Spatial Data in SQL Server

Spatial data types were first introduced in SQL Server 2008 and allow points, lines and shapes to be stored inside a column inside a database table. There are two spatial data types:
·         Geometry: Stores spatial data on a flat surface
·         Geography: Stores spatial data on a sphere, or to be more exact the earth

Data can be inserted into a geography column in a table using references to spatial data objects such as POINT, LINESTRING, POLYGON etc. Some example inserts into a table that has a Location column of type geography are:
INSERT INTO Site (ID, Location)
VALUES (1, 'POINT(51.508 -0.128)')--London

INSERT INTO Site (ID, Location)
VALUES (2, 'POINT(48.857 2.352)') --Paris

INSERT INTO Site (ID, Location)
VALUES (2, 'LINESTRING(1 1,2 3,4 8, -6 3)')


The spatial data types also have built in methods allowing spatial computations to be carried out as part of an SQL query. There are many such methods including: STDistance(), STIntersection(), STUnion() and STDifference(). The first of these STDistance() calculates the distance between two points or shapes, in metres when using the default coordinate system, as shown in the example below:

DECLARE @p1 geography
SELECT @p1 = Location FROM Site WHERE ID = 1
SELECT Location.STDistance(@p1) FROM Site WHERE ID = 2

The answer is just over 402793 metres which when divided by 1609.344 gives 250 miles which is correct given that the first point is in London and the second one is in Paris.
So spatial shapes can be stored in a database and calculations can be carried out on them in SQL queries. But how do we visualise spatial data? Well one way is to the use the mapping facility in SQL Server Reporting Services (SSRS).

Conveniently the AdventureWorks sample database has a geography column called SpatialLocation in the Address table. So to demonstrate the combined capabilities of SQL spatial data types and maps; I have devised an example report in SSRS that allows a user to select an address in New York together with a distance in miles and then display on a map all the addresses that are within the distance.
I first wrote a query to return all the addresses in New York. This query is used to populate the dropdown list for the user to select a starting address:
SELECT A.[AddressID], A.[AddressLine1] + ' '
       + ISNULL(A.[AddressLine2], '')
       + ' ' + A.[City]

       + ' ' + SP.StateProvinceCode
       + A.[PostalCode] AS [Address]

FROM [AdventureWorks].[Person].[Address] AS A
INNER JOIN [AdventureWorks].[Person].[StateProvince] AS SP

ON A.StateProvinceID = SP.StateProvinceID
WHERE SP.CountryRegionCode = 'US'
AND SP.StateProvinceCode = 'NY'
ORDER BY A.[PostalCode]

I then wrote a query to return all the addresses within @Distance of the selected property. Note the used of the STDistance() spatial method to calculate the distance between the addresses. This query will be used to plot the addresses on the map:
DECLARE @Distance int = 100 -- Parameter
DECLARE @NYAddress int = 770 – Parameter
SELECT A.[AddressID], A.[AddressLine1] + ' '
       + A.[City]

       + ' ' + SP.StateProvinceCode +
       A.[PostalCode] AS [Address],

       CONVERT(int, A.[SpatialLocation].STDistance(
             
A2.[SpatialLocation])/1609.344)
       AS [Distance], A.[SpatialLocation]

FROM [AdventureWorks].[Person].[Address] AS A
INNER JOIN [AdventureWorks].[Person].[StateProvince] AS SP

ON A.StateProvinceID = SP.StateProvinceID
INNER JOIN [AdventureWorks].[Person].[Address] AS A2
ON CONVERT(int, A.[SpatialLocation].STDistance(A2.[SpatialLocation])/1609.344)
       < @Distance

WHERE A2.AddressID = @NYAddress
ORDER BY [Distance]

Next step was to create a new blank SSRS report in SQL Server Data Tools and add:
·         A SQL Server data source connecting to AdventureWorks
·         Two data sets one for each of the SQL queries shown above
·         Two parameters, one for each of the parameters used in the second query
·         I dragged a Table item from the toolbox onto the report surface and configured it to display the Address and Distance columns for each for the selected addresses
·         I then dragged a Map item from the toolbox onto the report surface and configured it to plot the position of each of the selected addresses on a Bing map. To do this I went through wizard screens as shown below:


On this screen I selected “Layer Type” as Point and I checked the “Add a Bing Maps layer” option. I ignored the message about the @Display variable because I have defined it as a parameter and so I knew it would be OK.
 
For the rest of the Wizard screens I just selected the default options.

I then opened the Point Properties dialog for the Point Layer on the map and changed the fill colour to Red to make it easier to see the points on the map.
The result is below with 8 matching addresses shown for the 50 mile radius. Change the New York Address and the distance and click View Report and the map is rescaled and redrawn as required.

This is a simple example, but it shows how easy it is to create a spatially aware application using SQL Server. The database engine stores the locations and calculates the distances, while SSRS renders them nicely as a familiar and easy to use map.
 
This article is based on SQL Server 2012.

Saturday, 16 March 2013

PowerPivot: Excel PivotTables on Steroids?

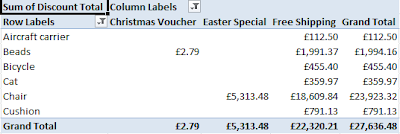
Pivot tables in Excel are an excellent tool and are used by many to aggregate and summarise data for reporting purposes. For example: A pivot table could be used to display product sales by month vs. region, department vs. year or as shown below: product vs. discount type:


If the original data is available in an Excel worksheet then the “Insert > Pivot Table” menu inserts a pivot table into the worksheet and presents a field list that can be used to drag and drop the required fields onto the table. This is all very straightforward and very powerful.
Earlier versions of Excel were limited to 65535 rows a worksheet. Later versions increased the limit to 1048576 rows. However the processing involved in combining data from worksheets and pivoting is computationally expensive and pivoting large volumes of data quickly becomes too slow. For data sets in excess of a million of rows it is simply not possible.

Excel pivot tables can also connect directly to external data sources such as SQL Server databases and cubes in SQL Server Analysis Server. Using an external data source in this way, and cubes in particular, is the usual way to pivot large volumes of data. Coverage of Analysis Server and the creation of cubes are beyond the scope of the blog, but they are a kind of large scale pivot table based on raw data in a database.
The snag is that although Excel pivot tables can be setup and used by a power user, Analysis Server cubes require a developer. Until that is, PowerPivot came on the scene with the release of SQL Server 2008 R2 and SQL Server 2012. PowerPivot allows a power user to combine data from Excel and external data sources such as databases and create large scale pivot tables without a developer. PowerPivot is essentially a cut down version of Analysis Server that is built into Excel. There is also a SharePoint version as well.

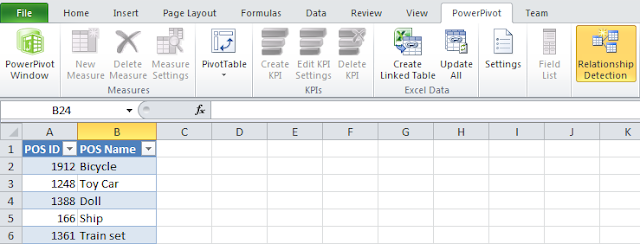
To trial the capabilities of PowerPivot I selected a customer database containing a table with 3.6 million rows of product sales and discount information. The database did not contain user friendly names for either the products or the discounts and so this information was added as Excel worksheets. I then selected the “Create Linked Table” on the “PowerPivot” menu as shown below to link my product and discount worksheets to PowerPivot (as shown below):

The next step was to select the “PowerPivot Window” menu in Excel followed by the “From Database” menu to create a sales data set base on a SQL query as shown below (as an alternative whole database tables can be loaded, avoiding the need to write SQL): 
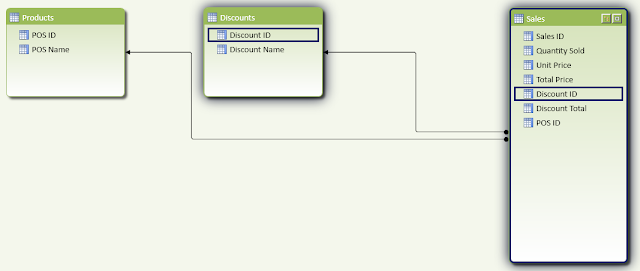
Next the “Diagram View” was used to join the SQL database to the two linked worksheets by dragging and dropping the keys:

At this point there is data from 3.6 million rows linked to two worksheets all in PowerPivot. New calculated columns can be added just by entering a normal Excel formula, as shown below for the new column CalculatedColumn1.

In the “Calculation Area” (the lower half of the screen below the data) new aggregate calculations such as “=Min([Total Price])”, can be added, again by just using standard Excel formulas. However PowerPivot automatically calculates all the obvious ones and so there is no need create simple examples like this.

Once the data is in place, click the “PivotTable” menu to create pivot tables and charts from the data in the normal Excel way, but this time using millions of rows of data.
I opted to select “POS Name” and “Discount Name” as slicers to allow the user to easily select the required data with the mouse. The pivot table shows discount and total price for the selected products and discounts. The pivot chart shows the breakdown of the discounts for the selected products and discounts. Selecting any combination of products and discounts in the slicers on the left recalculates and redisplays the table and chart in a fraction of section, even with 3.6 million rows, and I could go way higher than this.

Essentially this example shows how easy it is to create large scale pivot tables in Excel without having to manually define and create cubes using Analysis Server.
This article is based on SQL Server 2012 PowerPivot for Excel in Excel 2010.

Monday, 25 February 2013

What underpins the Microsoft Application Platform?

The Microsoft Application Platform (MAP) is a technology stack used for the development and deployment of high end enterprise level business applications. It provides for both on-premise, cloud and hybrid based deployments.

MAP is based on the following layers:
·         Windows Server provides for the Infrastructure Layer and includes support for the core functionality needed by any application such as security, virtualisation and networking. Windows Azure provides the same for cloud based deployments

·         SQL Server provides the Database Layer and includes support for transactional database programming and data warehousing. SQL Azure provides for cloud deployments

·         The Application Services Layer provides a fully functional middle tier and includes facilities such as message handing, work flow, state management and caching. This layer is covered by Microsoft .NET, Windows Server AppFabric and Microsoft BizTalk Server. For the cloud it is covered by Windows Azure Platform AppFabric

·         The top layer is the Application Layer which encompasses a number of line-of-business applications from the Microsoft Dynamics suite and in particular Microsoft Dynamics CRM, Microsoft SharePoint and Microsoft Exchange. For the cloud there is Office 365 for Exchange and SharePoint and Microsoft Dynamics CRM Online

 
In addition to the application layers there are supporting tools including Visual Studio for developers and Microsoft System Centre for system administrators to help monitor and manage the infrastructure, particularly relevant net with on-premise and hybrid deployments.
Note that SQL Server is used to provide the data layer for all of the key components of MAP including BizTalk, SharePoint, CRM and any custom components.

MAP is not just designed to support deployment of fixed packaged applications. One of its unique properties is that it provides the core functionality for custom applications without requiring development from scratch. For example:
·         SharePoint can be customised by:
o   Developing Web Parts that add new functionality to the web pages
o   Workflows can be developed to manage the handing of documents and other content
o   Event Receivers can add special processing when data changes
o   Developing new page layouts that control how pages are edited in the content management system

·         Microsoft CRM also has a programming interface that supports the development of custom:
o   Data entities
o   Screens
o   Reports

·         BizTalk and .NET are development environments and so directly support customisation

·         Exchange also supports customisation through its Web Service and Message Filter facilities and the ability to change the appearance of Outlook Web Access
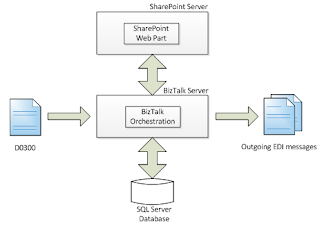
An example of how an enterprise system in the electricity industry has been developed using the Microsoft Application Platform is covered below. This is of course based on a real example:
·         An Electronic Data Interchange (EDI) file of type D0300 arrives at an electricity supplier. The file is of type D0300 which is the format for “Disputed or Missing Readings on Change of Supplier”

·         BizTalk server:
o   Picks up the incoming messages and converts the EDI format into XML format
o   Executes a BizTalk Orchestration workflow that takes the XML message and carries out validations on the readings and meters it contains and updates state of the reading in the SQL Server database
o   Issues outgoing EDI messages to other market participants on the state of the disputed reads
o   Makes web service calls to the line-of-business CRM system to update the state of the customer account associated with the disputed read

·         Call Centre staff login to a SharePoint Portal and access the Disputed Reads page
o   This page contains a custom .NET Web part that accesses the disputed read tables in SQL Server via an Web Service calls to an Orchestration in BizTalk and allows the operator to raise new disputed reads and manage existing ones 

The above demonstrates the power of MAP. Windows provides the infrastructure. SQL Server provides the data platform. SharePoint provides the portal with authentication and security to manage permissions and BizTalk provides the message handling and workflow capabilities.
A full- blown enterprise level system with the minimal custom code.